Seal Beach
Bridgeport/Seal Beach Real Estate
Bridgeport/Seal Beach is a community of mostly single-family homes in Seal Beach, CA 90740. Many of its homes date from the 1960s, with 2 to 4 bedrooms and about 1,400 to 2,100 square feet. The community is in the Los Alamitos Unified School District. The MLS has recorded 93 sales here since 2012. The latest sale in the list below closed in September 2026 at $1,150,000.
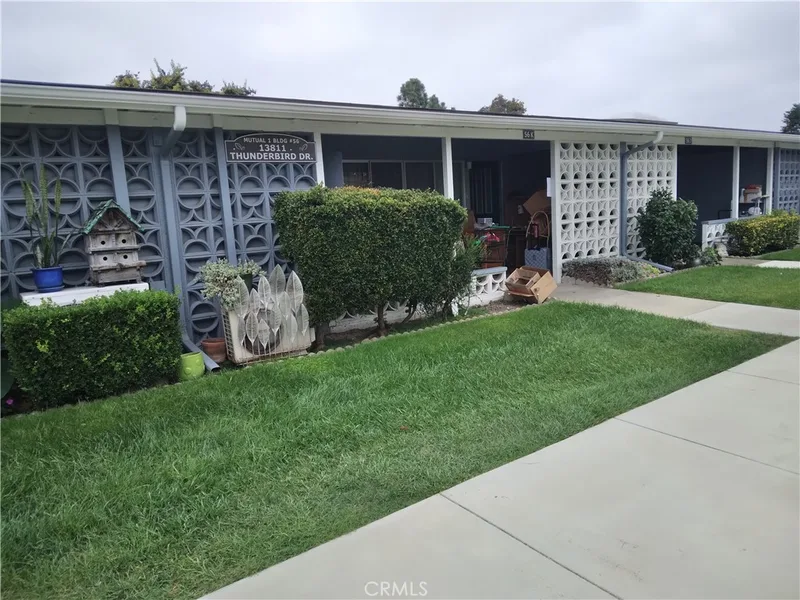
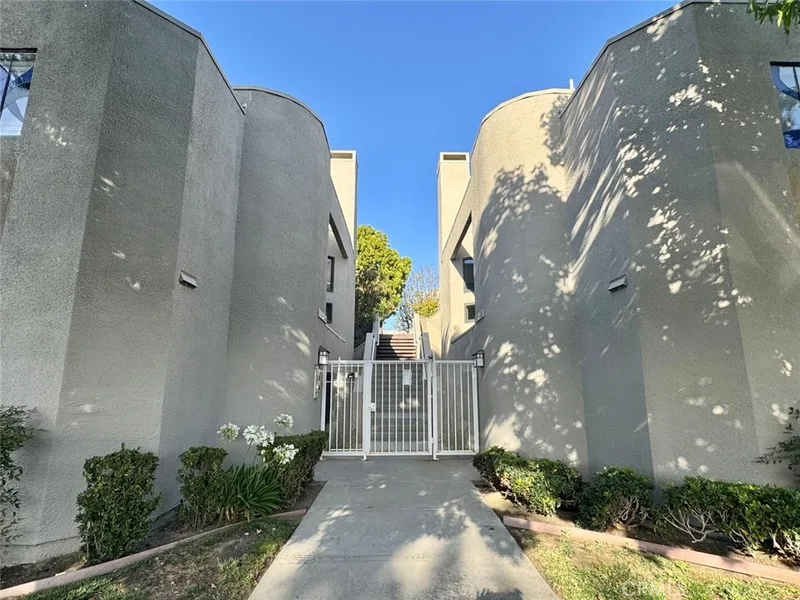
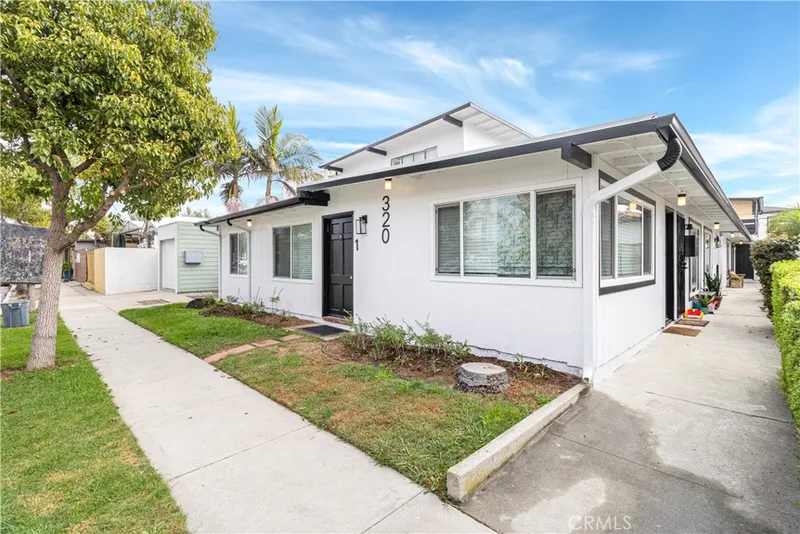
3 homes are for sale in Bridgeport/Seal Beach. The mix is co-ops, condos and other homes. Asking prices run from $232,500 to $3,895,000. They range from 1 to 2 bedrooms.
3
Homes for sale
$575,000
Median asking price
6
Closings in 12 months
$1,774,500
Median recorded closing
Bridgeport/Seal Beach Homes for Sale
Recent Sales in Bridgeport/Seal Beach
6 closings recorded in the MLS over the last twelve months.
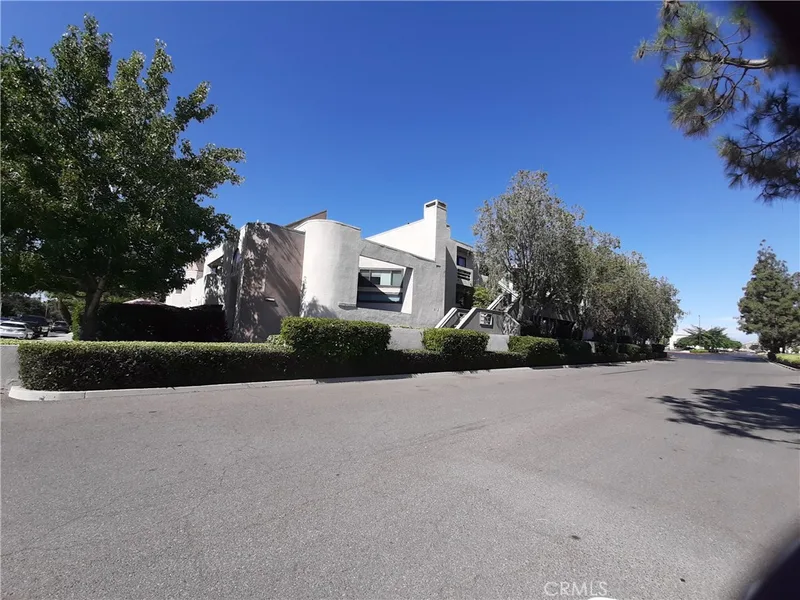
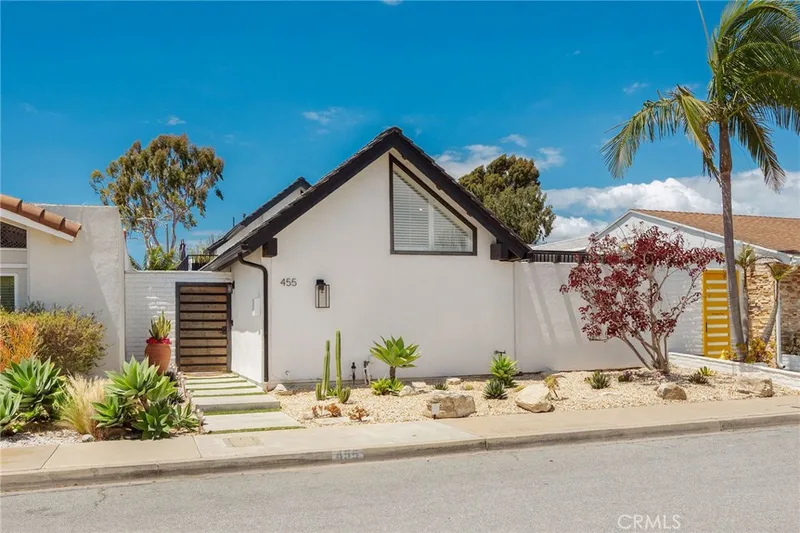
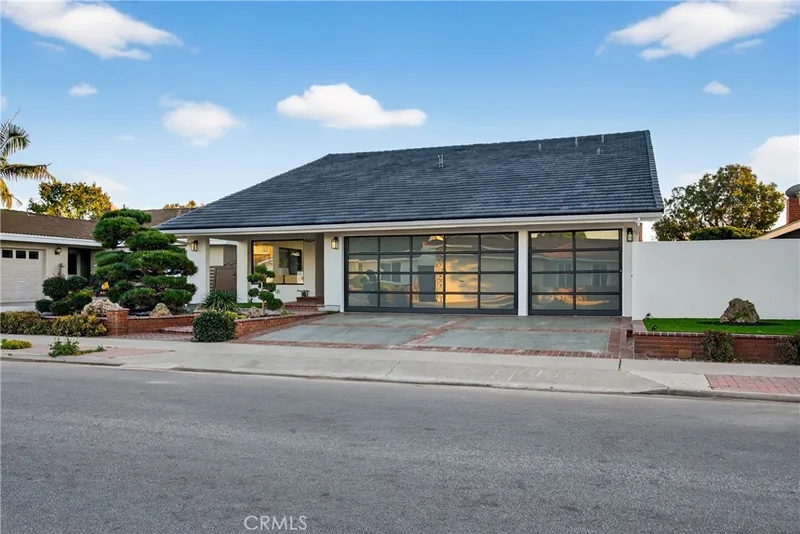
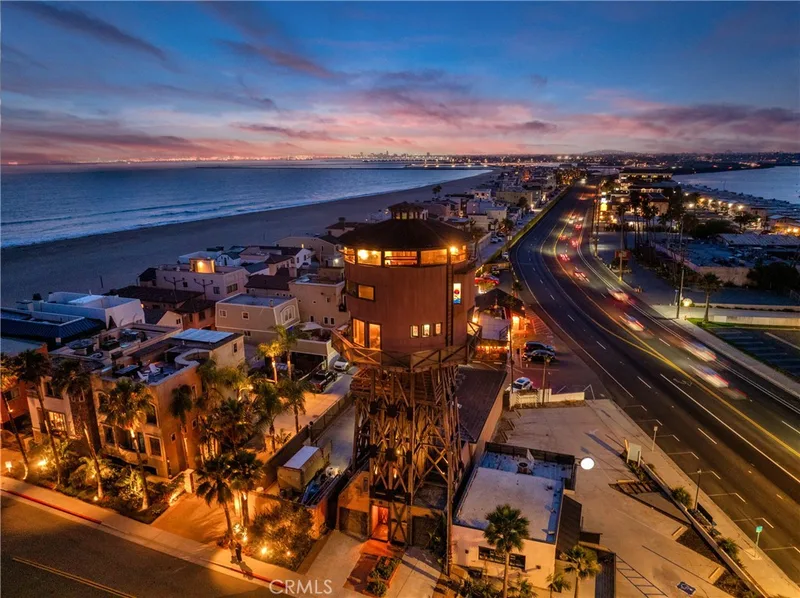
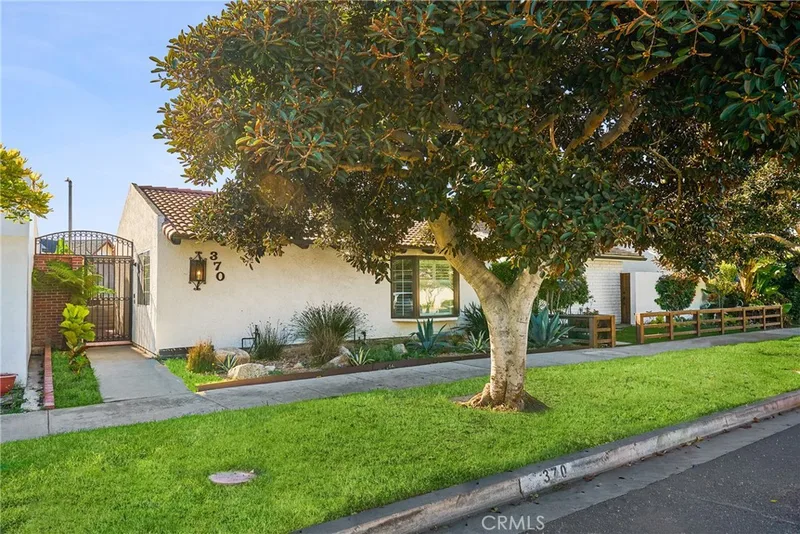
Earlier Sales in Bridgeport/Seal Beach
| Closed | Price | Beds | Baths | Sq ft | Home |
|---|---|---|---|---|---|
| Sep 24, 2025 | $1,800,000 | 3 | 2 | 1,702 | 3-bed single-family home, $1,800,000 |
| Sep 19, 2025 | $1,550,000 | 3 | 2 | 1,363 | 3-bed single-family home, $1,550,000 |
| Aug 21, 2025 | $1,683,000 | 3 | 2 | 1,702 | 3-bed single-family home, $1,683,000 |
| Aug 1, 2025 | $1,541,000 | 3 | 2 | 1,702 | 3-bed single-family home, $1,541,000 |
| May 1, 2025 | $1,725,000 | 4 | 2 | 1,702 | 4-bed single-family home, $1,725,000 |
| Nov 8, 2024 | $1,745,000 | Duplex, $1,745,000 | |||
| Oct 29, 2024 | $2,731,000 | 4 | 3 | 2,767 | 4-bed single-family home, $2,731,000 |
| Oct 23, 2024 | $1,880,000 | 4 | 3 | 2,680 | 4-bed single-family home, $1,880,000 |
| Sep 10, 2024 | $1,525,000 | 3 | 2 | 1,596 | 3-bed single-family home, $1,525,000 |
| Jul 17, 2024 | $1,125,000 | 3 | 3 | 2,299 | 3-bed single-family home, $1,125,000 |
Bridgeport/Seal Beach Sales by Year
| Year | Sales | Median price | Median price per sq ft |
|---|---|---|---|
| 2026 to date | 6 | $1,774,500 | $1,004 |
| 2025 | 6 | $1,616,500 | $1,001 |
| 2024 | 10 | $1,812,500 | $907 |
| 2023 | 3 | ||
| 2022 | 6 | $1,525,000 | $943 |
| 2021 | 14 | $1,360,000 | $830 |
| 2020 | 10 | $1,157,500 | $638 |
| 2019 | 6 | $714,500 | $467 |
| 2018 | 4 | ||
| 2017 | 4 | ||
| 2016 | 8 | $901,250 | $605 |
| 2015 | 5 | $1,000,000 | $526 |
| 2014 | 4 | ||
| 2013 | 5 | $830,000 | $543 |
| 2012 | 2 |
A Typical Home in Bridgeport/Seal Beach
- Home types
- Single-family homes 75%, Condos 11%, Co-ops 5%, Other homes 9%
- Bedrooms
- 2 to 4
- Living area
- 1,363 to 2,089 sq ft
- Year built
- 1968 to 1974
- Lot size
- 3,090 to 3,762 sq ft
- Private pool
- 6% of single-family homes
- Scenic view
- 13% of homes
Each range is the middle half of the homes that report it, among the 84 homes sold since 2012 or for sale now in Bridgeport/Seal Beach. Lot sizes leave out condos, townhomes, co-ops and co-ownership homes. The pool share counts single-family homes for sale now or sold since 2017. A scenic view is a water, hill, mountain, canyon, valley, bluff, city-lights, golf-course or panoramic view. Source: CRMLS.
Bridgeport/Seal Beach Market Snapshot
23Median days on market
98.4%Median sale price to final list price
From the 22 recorded home sales that closed in the last three years. Source: CRMLS.
For Bridgeport/Seal Beach Homeowners
What's your home in Bridgeport/Seal Beach worth? Request a home valuation from Realatrends Real Estate.
Nearby Seal Beach Communities
Other Seal Beach Neighborhoods
Seal Beach Homes by Type and Feature
Seal Beach Single-Family HomesSeal Beach CondosSeal Beach Multi-Family PropertiesSeal Beach Manufactured HomesSeal Beach Ocean View HomesSeal Beach Single-Story HomesSeal Beach Gated Community HomesSeal Beach Homes Under $500KSeal Beach Homes Under $1 MillionSeal Beach Homes Under $2 MillionSeal Beach Luxury HomesSeal Beach New ListingsSeal Beach Price-Reduced Homes
Listing alerts
Be first to see new Orange County listings
What criteria are you looking for?
New Orange County homes by email, often before they reach the big portals.
You are all set.